Market Participant Groups Effect on Candlestick Patterns
Any trader can have
the periodic big gain trade, but it is the consistent trader who makes a living
from the Stock Market.
Recognizing Support
and Resistance in stock charts is the foundation of good, profitable trades
consistently over time.
Support and
Resistance are relevant to both price patterns and Market Conditions. For
example a Bottoming Market Condition has pent-up energy building, from the draw
of liquidity by hidden Dark Pools buying bargain priced stocks in an
accumulation mode. Therefore the resistance that would usually stall price or
cause it to retrace, can be easily pushed through with momentum action.
TechniTrader is
"The Gold Standard in Stock Market Education." Go to TechniTrader and
watch the How to Trade the Stock Market Webinar for Beginners, to experience
for yourself the excellence of TechniTrader education.
Go
to the TechniTrader
In the stock market today there are classic Dark Pool Buy Zone™ bottoming formations. The problem is that these bottoms are a collision between three powerful Market Participant Groups.
Those three groups are the following:
1. High Frequency Traders driving price down with huge quantities of orders sent to the exchanges on the millisecond, that they generate an imbalance between the buyers and sellers which either gaps the stock or runs the stock.
2. Smaller Funds are in capitulation mode as they either sell to get out of what they believe is a total loss, OR they sell as the stock moves up assuming that they are getting a “better price” for the sell of the stock. This is similar to the foolish “Buy on the Dip” strategy during a Bear Market. In a Bottoming Market, selling into a bounce is a great way to energize the Dark Pools buying.
3. Giant Institutions using Dark Pools to accumulate, are buying into the final selling spree created by High Frequency Traders and their followers, who are the Smaller Funds and the Retail crowd. Buying the stock in larger lots than the other side is selling, halts the downtrend and commences the bottom. In addition liquidity shifts from sellers to buyers.
Go to TechniTrader and watch "The Basics of the
Stock Market for New Investors and Beginning Traders" Webinar Lessons, to
experience for yourself the excellence of TechniTrader education. TechniTrader
is "The Gold Standard in Stock Market Education."
Recognizing
Support and Resistance in stock charts begins with these three important
Market Participant Groups that collide in bottoms and in tops, with the winner
always being the Dark Pools.
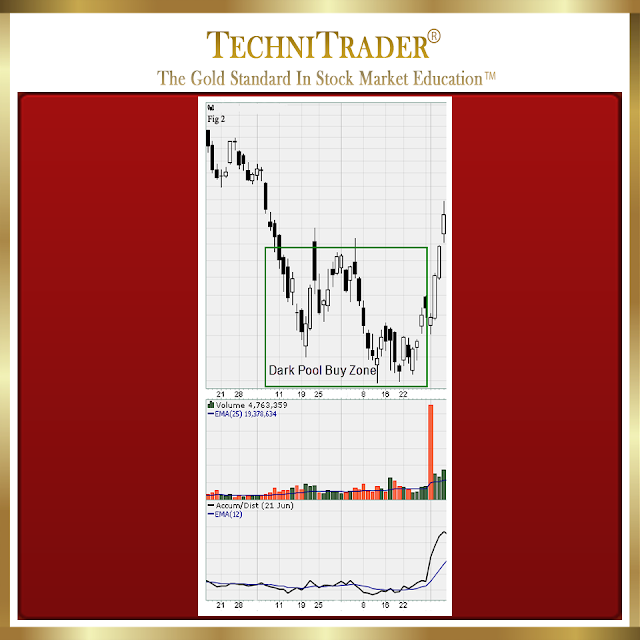
The chart example
below has the Dark Pool Buy Zone outlined in green.
The momentum run down
is Professional Traders. Their activity is technical and they are the easiest
trade to ride with when momentum starts, as they always follow technical rules
and they do not become emotional in the trade. Their Volume is moderate as
their average trade size is 10,000 to 50,000 shares.
A Dark Pool Buy Zone
in the collision area, will generate a lot of what appears to be impassible
resistance. However what most traders fail to remember is that the “Buy Zone”
is a buying zone, where their Time Weighted Average Price orders trigger
intermittently set on Time and Price rather than Volume and Price.
The huge Volume surge
in the top indicator window, is a day of High Frequency Traders heavy order
flow. The High Frequency Traders was attempting to sell down, but instead Dark
Pools reacted to the sell and started triggering Time Weighted Average Price
buy orders.
The momentum energy
from the Buy Zone creates a three day Velocity Run, which is the favorite kind
of run for Swing Traders.
TechniTrader is
"The Gold Standard in Stock Market Education." Go to the TechniTrader
Learning Center and watch the Swing Trading Webinar, to experience for yourself
the excellence of TechniTrader education.
The Velocity Run
shifts to profit taking, as Smaller Funds and Retail Traders rush to buy the
stock after the run is already well underway. Profit taking creates a shift to
a sideways pattern, which is a Platform Candlestick Pattern Formation.
It moves up as
Platforms commonly do after a resting, high range compression. This is not
going to be a Swing Style Trade at this point though, because the buyers at
this level are Giant Institutions using Dark Pools once again in accumulation
mode. Professional Traders have moved on, because of resistance.
On the Weekly View
chart the Technical Resistance is evident, and is the reason why the
Professional Traders Market Participant Group have not continued to trade
heavily. Volume over several weeks slips to a much lower level, and the
Accum/Dist Indicator in the bottom window starts to float.
Summary
When a trader
understands who is controlling price, then Recognizing Support and
Resistance in stock charts and how it will behave, becomes easier to
determine. Technical Support is created by Technical Traders. Fundamental
Support is created by the Fundamental Investors who are the Giant Institutions.
Go to the TechniTrader
Learning Center and watch a wide variety of webinars, to experience for
yourself the excellence of TechniTrader education.
Go
to the TechniTrader
Followers of this
blog may request a specific article topic by emailing: info@technitrader.com
Trade Wisely,
Martha Stokes CMT
Trade Wisely,
Martha Stokes CMT
TechniTrader technical analysis using StockCharts charts, courtesy of StockCharts.com
Chartered Market Technician
Instructor & Developer of TechniTrader Stock and Option Courses
©2016–2024 Decisions Unlimited, Inc. dba TechniTrader. All rights reserved.
TechniTrader is also a registered trademark of Decisions Unlimited, Inc.
Disclaimer: All statements are the opinions of TechniTrader, its instructors and/or employees, and are not to be construed as anything more than an opinion. TechniTrader is not a broker or an investment advisor; it is strictly an educational service. There is risk in trading financial assets and derivatives. Due diligence is required for any investment. It should not be assumed that the methods or techniques presented cannot result in losses. Examples presented are for educational purposes only.


