The Importance of a Volume Oscillator Indicator
The most difficult
aspect of reading stock charts for most Technical and Retail Traders are the
sideways patterns. Many traders simply do not know how to interpret sideways
patterns, to determine in advance whether the stock will move up or down out of
the sideways pattern.
Learning to read
sideways patterns requires not only candlestick analysis, but also the proper
indicators that help. One extremely useful indicator is the StockCharts.com
ChiOsc Indicator, which is a volume oscillator. Most Retail Traders are not
familiar with volume oscillators. In our modern automated, multi-venue Stock
Market they have become essential indicators for those who want to make a
living trading stocks, or those who wish to augment their income from trading
stocks or options.
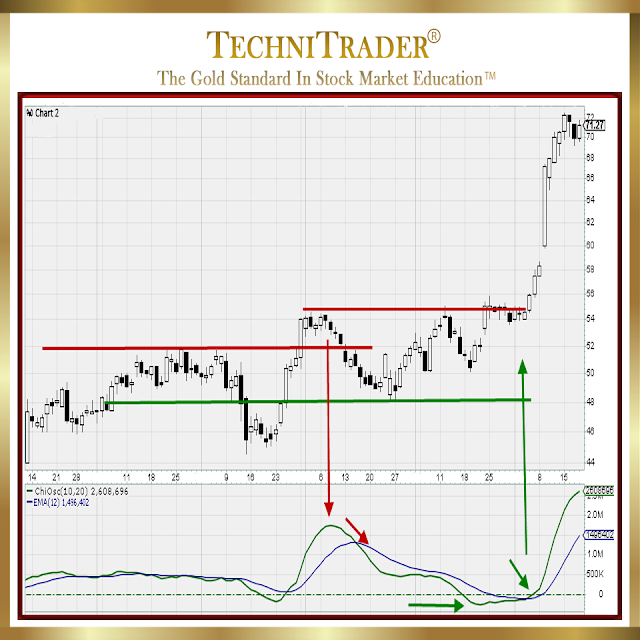
The chart example
below is a fine example of the importance of a volume oscillator for
identifying breakout patterns prior to Momentum Runs. I have drawn red lines to
indicate Resistance, and a green line to indicate Support. I have also blocked
out the right side of the chart, and the indicator window.
Unlike price
oscillators the analysis is not overbought or oversold, but rather overextended
patterns either at the high or low of a run. This provides invaluable analysis
for Day, Swing, Momentum, and Position Trading, which is not to be confused with
Positional Trading.
Go watch the Swing Trading Video to learn about precision entries
and exits, and how to use leading indicators to enter before price moves.
Go
to TechniTrader
The sideways pattern
in this chart example has many important factors to study in the candlesticks,
but without a volume oscillator for Relational Analysis™ they are lost.
The stock moved above
a moderate resistance level but then retraced. Why? Price alone does not
explain why nor does it warn that the support would not hold, which is a
problem for Short-term Traders, who might assume that moderate support should
hold.
Support does not halt
the run down until well beyond the prior moderate support lows. Why? The
candlesticks alone do not explain this price action.
More importantly will
the current price action be able to break to the upside, or will it go back
down and run down again? Price alone does not indicate what will happen next.
Will the stock move up or will it move down. If you want to be a highly
successful and profitable trader, this is a BASIC question that you must be
able to answer.
Now let’s look at the
same chart with the ChiOsc volume oscillator window added. See the chart
example below.
Volume oscillators
have far more signals, patterns, and analysis than overbought/oversold price
indicators. It does take more time to learn how to interpret them properly, but
it is time well spent. The Why of price action is in VOLUME for identifying
breakout patterns prior to Momentum Runs.
Go watch the Best
Volume Indicators Training Webinar, to learn why volume is as important as
price analysis, and why volume leads price.
Go to the TechniTrader
For the failed
attempt to break to the upside and sustain the price above the highs of the
prior resistance, volume shows clearly an overextended pattern that quickly
declines even BEFORE price drops down after the consolidation. Leading price,
the ChiOsc Indicator tells you the volume is insufficient for the stock to hold
this price. The indicator also shows during the run down that it will go beyond
the lows of that consolidation.
Then the ChiOsc
troughs above the low of the chart, angling upward even while price once again
consolidates below the moderate resistance level. The crossover is a signal
that confirms the candlestick buy entry signal. This provides a low risk entry
before the stock moves with momentum.
The final extreme
overextended ChiOsc Indicator pattern indicates High Frequency Traders have
taken control of price, and the stock will stall in its run up or encounter
profit taking.
Go to the Learning
Center and watch a wide variety of training webinars including Bollinger Bands,
How to Trade Stocks, Candlestick Patterns, and Technical Analysis.
Go
to the TechniTrader
Summary
Volume oscillators are
one of the most important indicators for trading the automated market where
more and more professionals are using alternative trading venues which leave
the Retail Trader in the dark. Price oscillators offer minimal help. Volume
oscillators show why price is behaving as it is, and indicate how price will
move in the near term.
Beginners go watch
“The Basics of the Stock Market for New Investors and Beginning Traders” 12
Webinar Lessons.
Go
to the TechniTrader
“Basics of Stock Market New Investors & Beginning Traders”
12 Webinar Lessons
TechniTrader
The
Gold Standard in Stock Market Education
Trade Wisely,
Martha Stokes CMT
TechniTrader technical analysis using a StockCharts chart, courtesy of StockCharts.com
Chartered Market Technician
Instructor & Developer of TechniTrader Stock and Option Courses
TechniTrader DVDs with every course.
©2016–2024 Decisions Unlimited, Inc. dba TechniTrader. All rights reserved.
TechniTrader is also a registered trademark of Decisions Unlimited, Inc.
Disclaimer: All statements are the opinions of TechniTrader, its instructors and/or employees, and are not to be construed as anything more than an opinion. TechniTrader is not a broker or an investment advisor; it is strictly an educational service. There is risk in trading financial assets and derivatives. Due diligence is required for any investment. It should not be assumed that the methods or techniques presented cannot result in losses. Examples presented are for educational purposes only.


